|
|
|
Monthly Archives: April 2018


ERCID Data goes “live”
 Geocentric as the Management Company or the ERCID has taken the bold step to introduce live operational statistics to all its CID contributors. With our Mobile Reporting App and our “State of the Art” management system we can update our operational data direct to the ERCID Website.
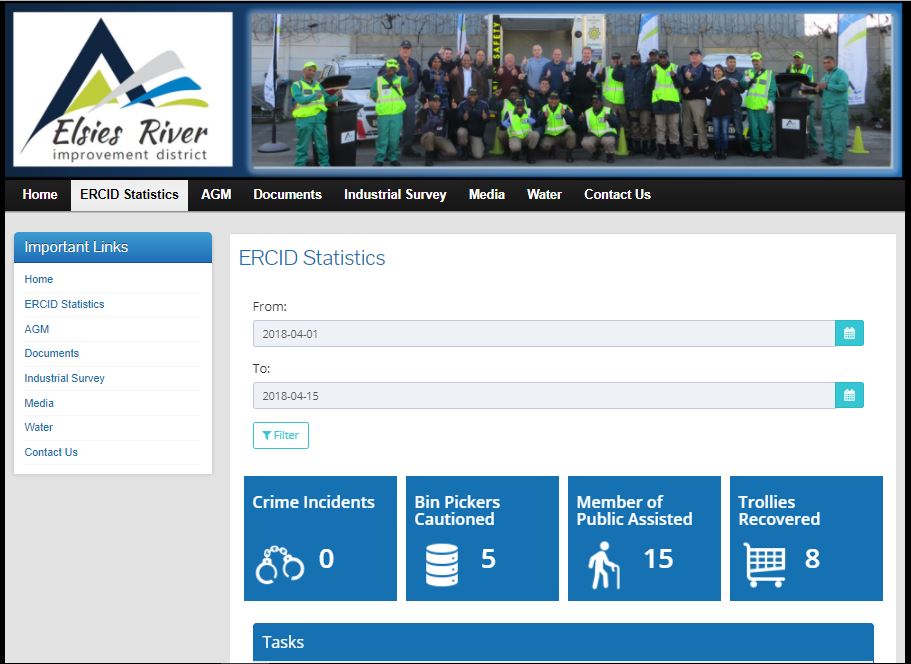
By simply going to our ERCID Statistics page you will have live, up-to-date information of the work we are doing in the ERCID. As data arrives from the field into our management system, relevant statistics will automatically update on our ERCID website.
 Operational data is shown in three different formats including “counters” (this shows the number of incidents of a certain type), Graphs and Maps. The map data displays the location and clustering of specific types of incidents depending on the theme of the map. You can even look back in time using the date filter on the page. The dashboard
 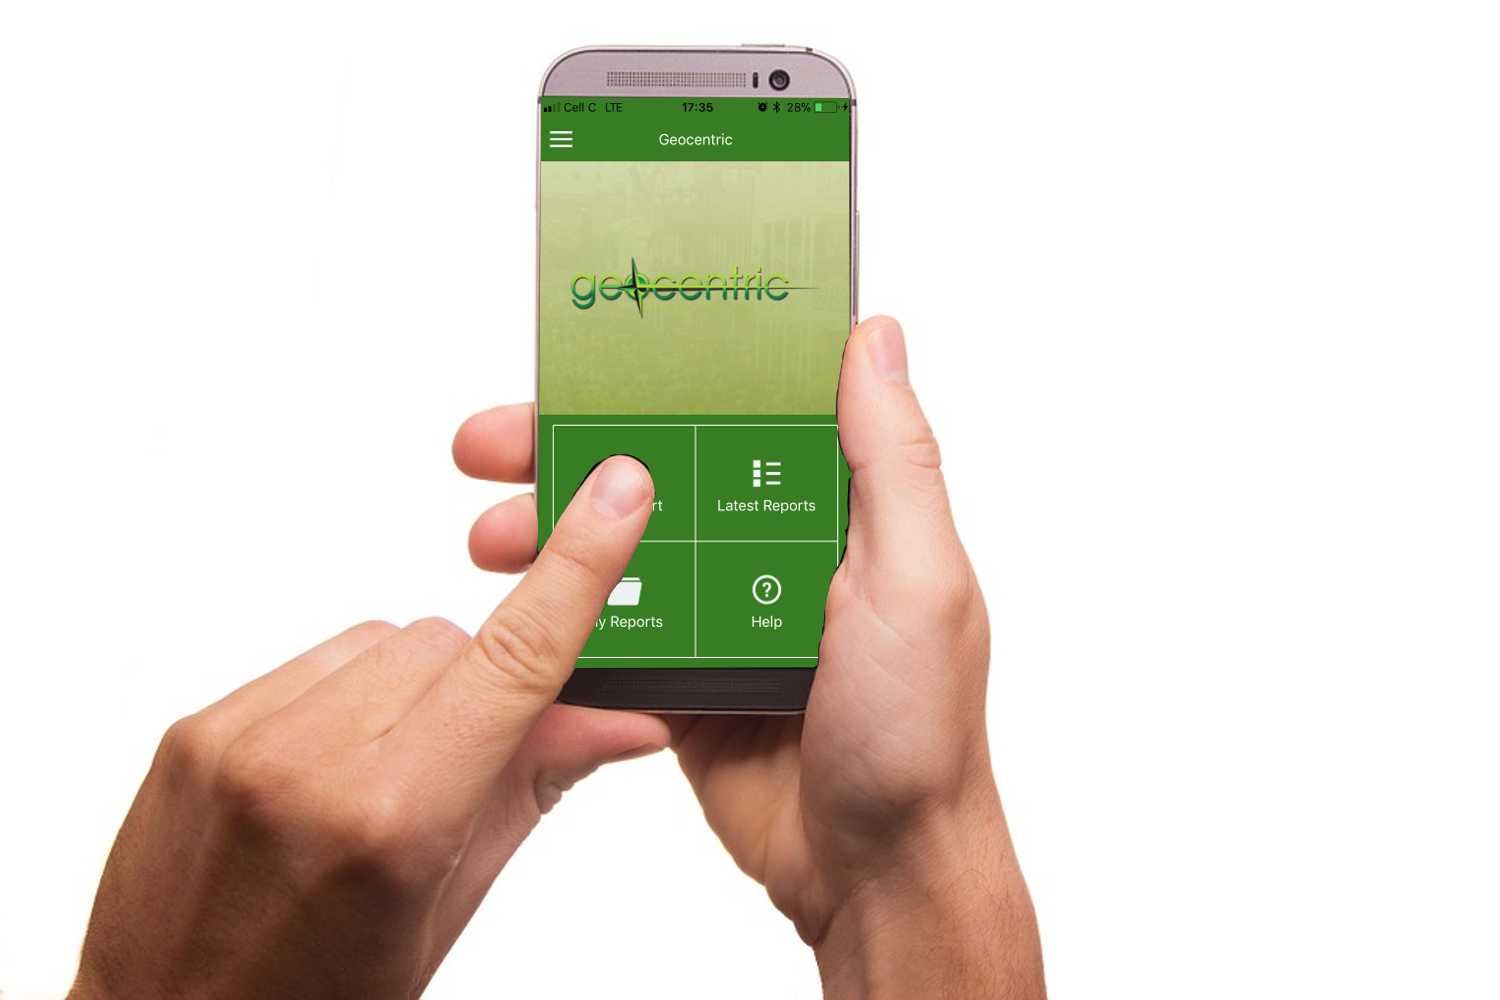 will always show the accumulated information for the current month.
We believe that our ERCID property and business owners and our ERCID users should have the ability to see what we are doing and be informed daily.
You can also stay in touch with incidents and alerts within the ERCID by downloading the Mobile Reporting App. It Is available from both the Apple iStore and the Google Play Store for iOS and Android devices.